
First, the parameters of the elliptic curve are defined. The complete graph based on the generator point G can then be visualized. By manually increasing the value of n (here, n = 4) step by step, the corresponding points on the curve can be traversed sequentially. For technical reasons, the value of p should not exceed 101.
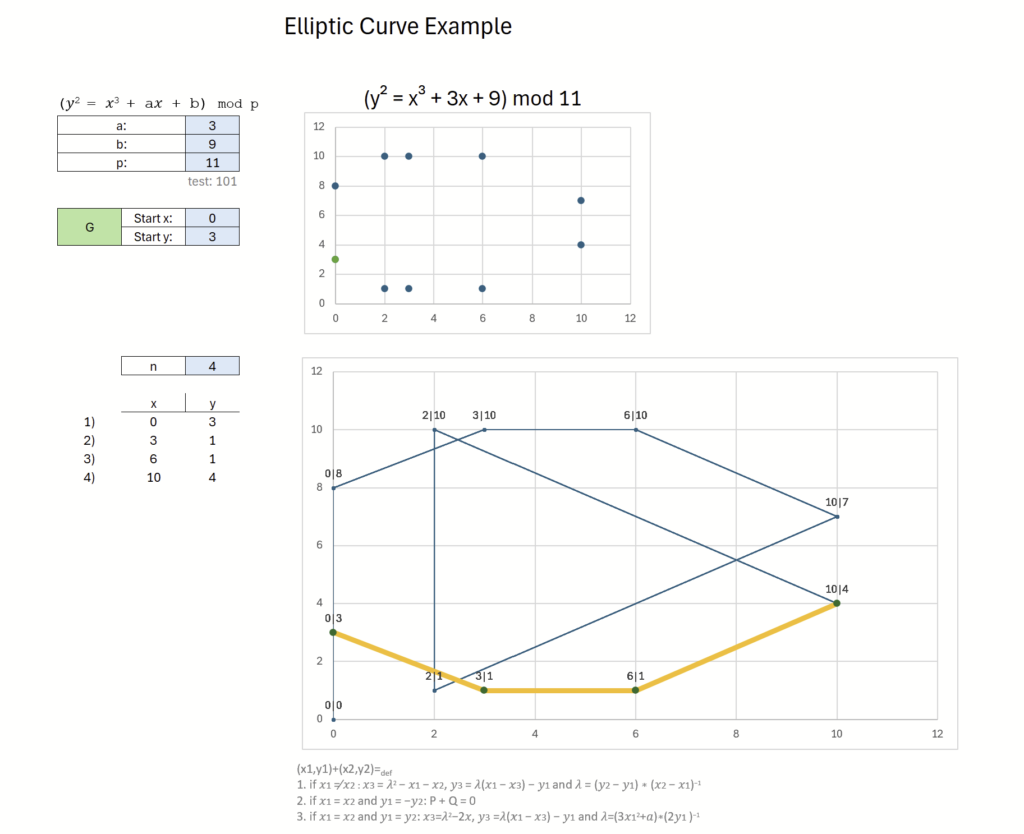
In addition to the visualization, the key exchange can be simulated for both parties in the second tab („ECDH“). For this purpose, each party selects a secret value, a and b, respectively. In this setting, the private values should be chosen to be smaller than 11. To allow for a larger selection of possible keys, p can be set to 101. Based on the selected private values, the resulting points on the curve are calculated and displayed graphically.
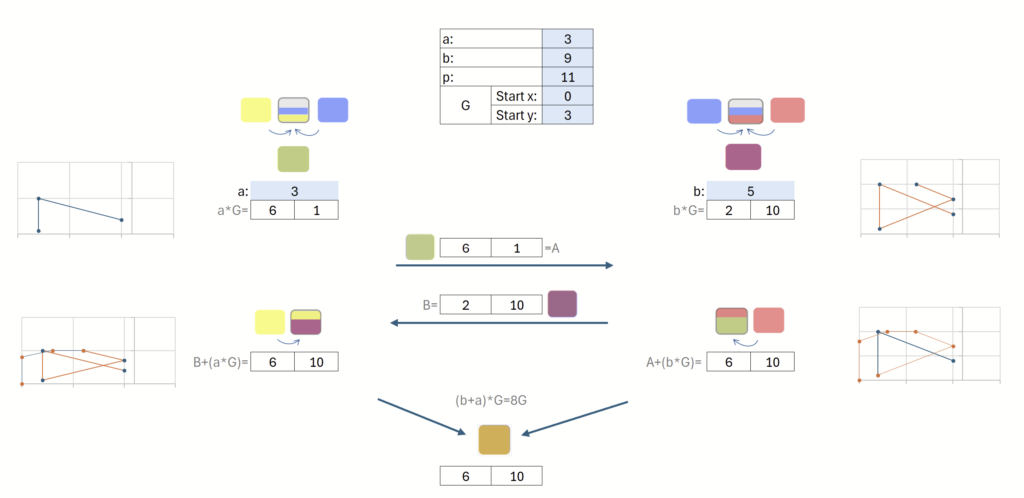
In the end, both parties arrive at the same result. The shared secret can be chosen as either the x-coordinate or the y-coordinate.
Download the Microsoft Excel file. Macros have intentionally been avoided; however, due to the use of LAMBDA functions, the file will only work with Microsoft 365 or Excel 2024.
SHA256: 4793C48FF7F00D1DDF920DD92AC1AA3B8E607A03282818FC14A4E60D09E48CC6